Florida State University Search

Facilities
A Culture of Efficiency: Campus Utility Dashboard
09/16/2024
In the summer of 2024, Florida State University Facilities launched a Campus Utility Dashboard to monitor and gather insights about energy consumption on campus. The goal was to provide an interactive tool for users to visualize campus utility usage and plan for a more sustainable and efficient campus energy management program.
"This opportunity to give our customers a window into sustainability and energy initiatives has been a long-time goal," Director of Campus Sustainability Elizabeth Swiman said. "The data project represents the culmination of broad efforts to present information in a useful manner for our campus community. It also emphasizes the diversity of our campus buildings, which vary in age, size, and use, each contributing to the overall story of energy consumption."
The Facilities Maintenance & Utilities Campus BAS team, led by BAS Specialist Marcela Castaño and two-year, developer intern, Kiran Muppana, selected the PowerBI data visualization platform, the University standard for dashboards, to illustrate the campus' utility consumption. The dashboard interacts with data from AiM, a facility and asset management system that serves as the repository of utility usage for all buildings on campus. The utility data is provided by various utility companies, including the City of Tallahassee, and internal data from the multiple meters on campus connected to the Building Automation System (BAS).

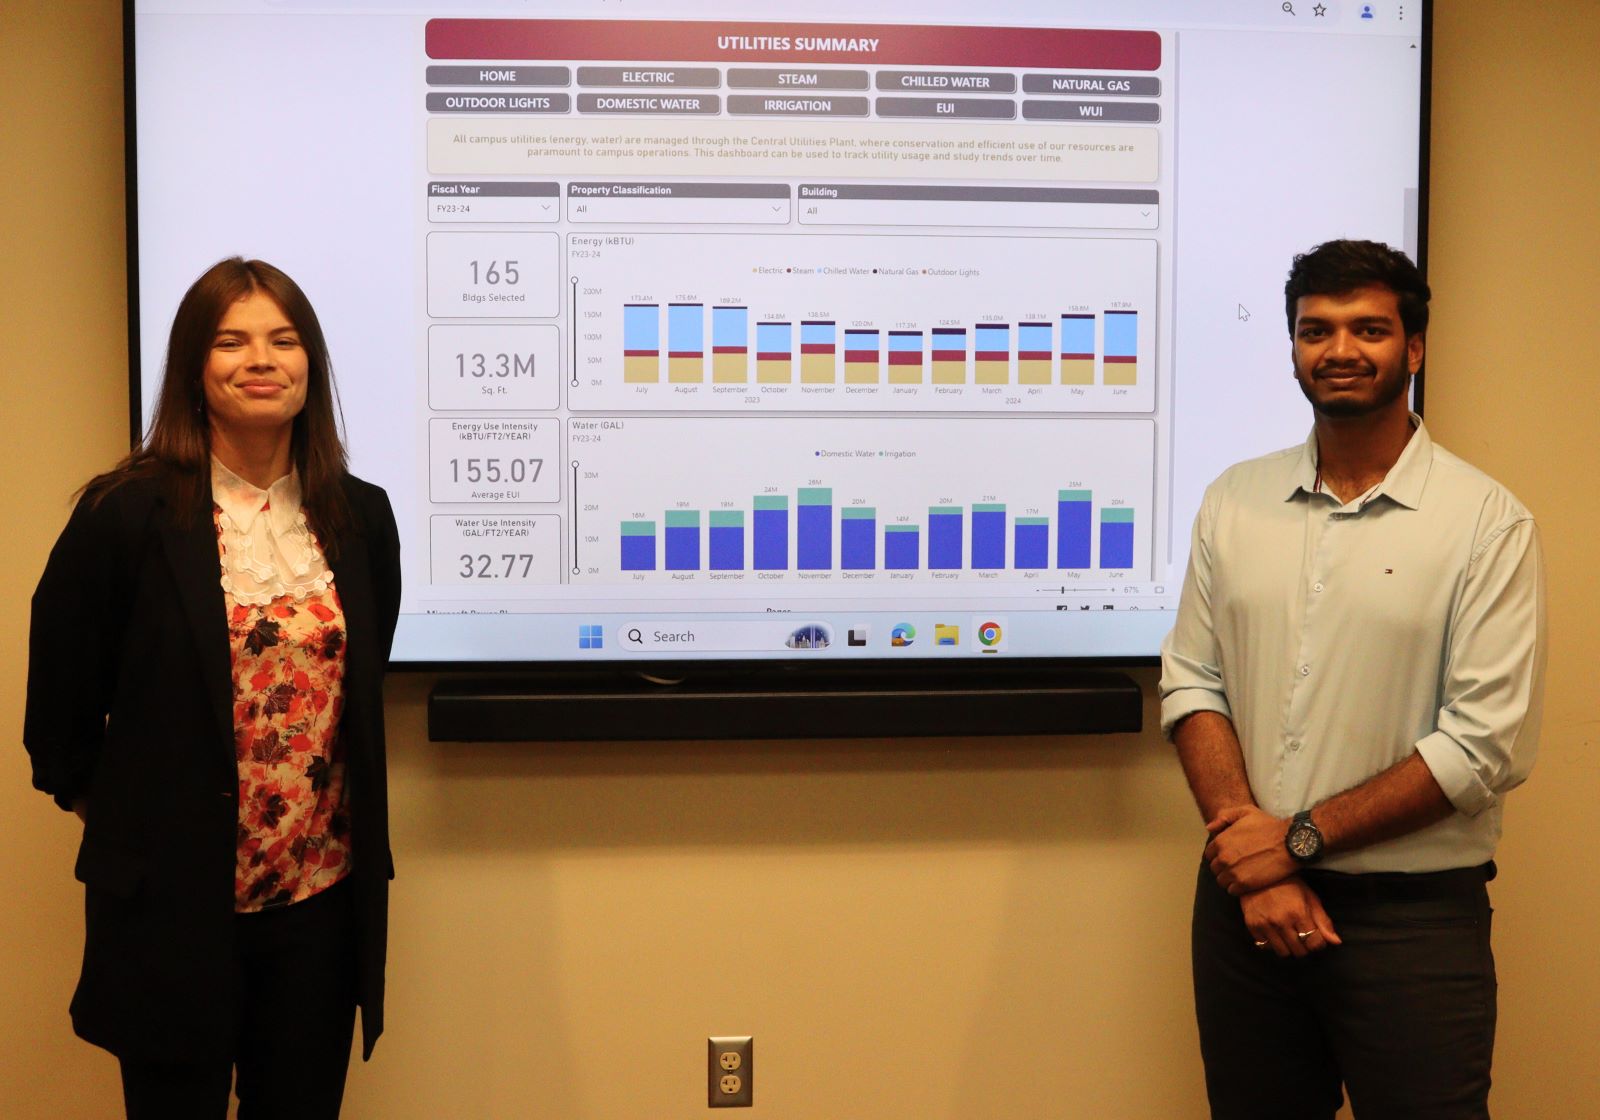
BAS Specialist Marcela Castaño and Intern Kiran Muppana
The dashboard’s data is gathered and cleaned through Python scripts and seamlessly integrated into the Power BI cloud. Building information is refreshed monthly to include new consumption records and account for any changes in the campus landscape. The team encountered some challenges along the way, such as data availability, inconsistencies due to input errors and building name changes over time that needed to be rectified. Data privacy and security features require extensive coordination with the university’s Information Technology Services. The dashboard's comprehensiveness and accuracy are a testament to the collaborative effort of Maintenance & Utilities’ campus partners.
The dashboard provides various charts and lists displaying the use of electricity, steam (used for heating and dehumidifying campus buildings and generating hot water), chilled water (used for cooling buildings), natural gas (used for steam production, water heating, and commercial kitchens), outdoor lighting, domestic water, and irrigation consumption by building on campus. The Energy Use Intensity (EUI) metric compares energy consumption across buildings based on square footage. Some property types and facilities naturally require more energy than others. Similarly, Water Use Intensity (WUI) shows water consumption data, but for water use.
The dashboard meets efficiency and sustainability objectives by answering consumption questions and providing transparency. It can identify potential issues before they become significant problems, helping Maintenance & Utilities staff understand what factors cause spikes and lead to cost savings. Outside of utilities, it allows campus partners to do their own research and evaluate energy use across the university.
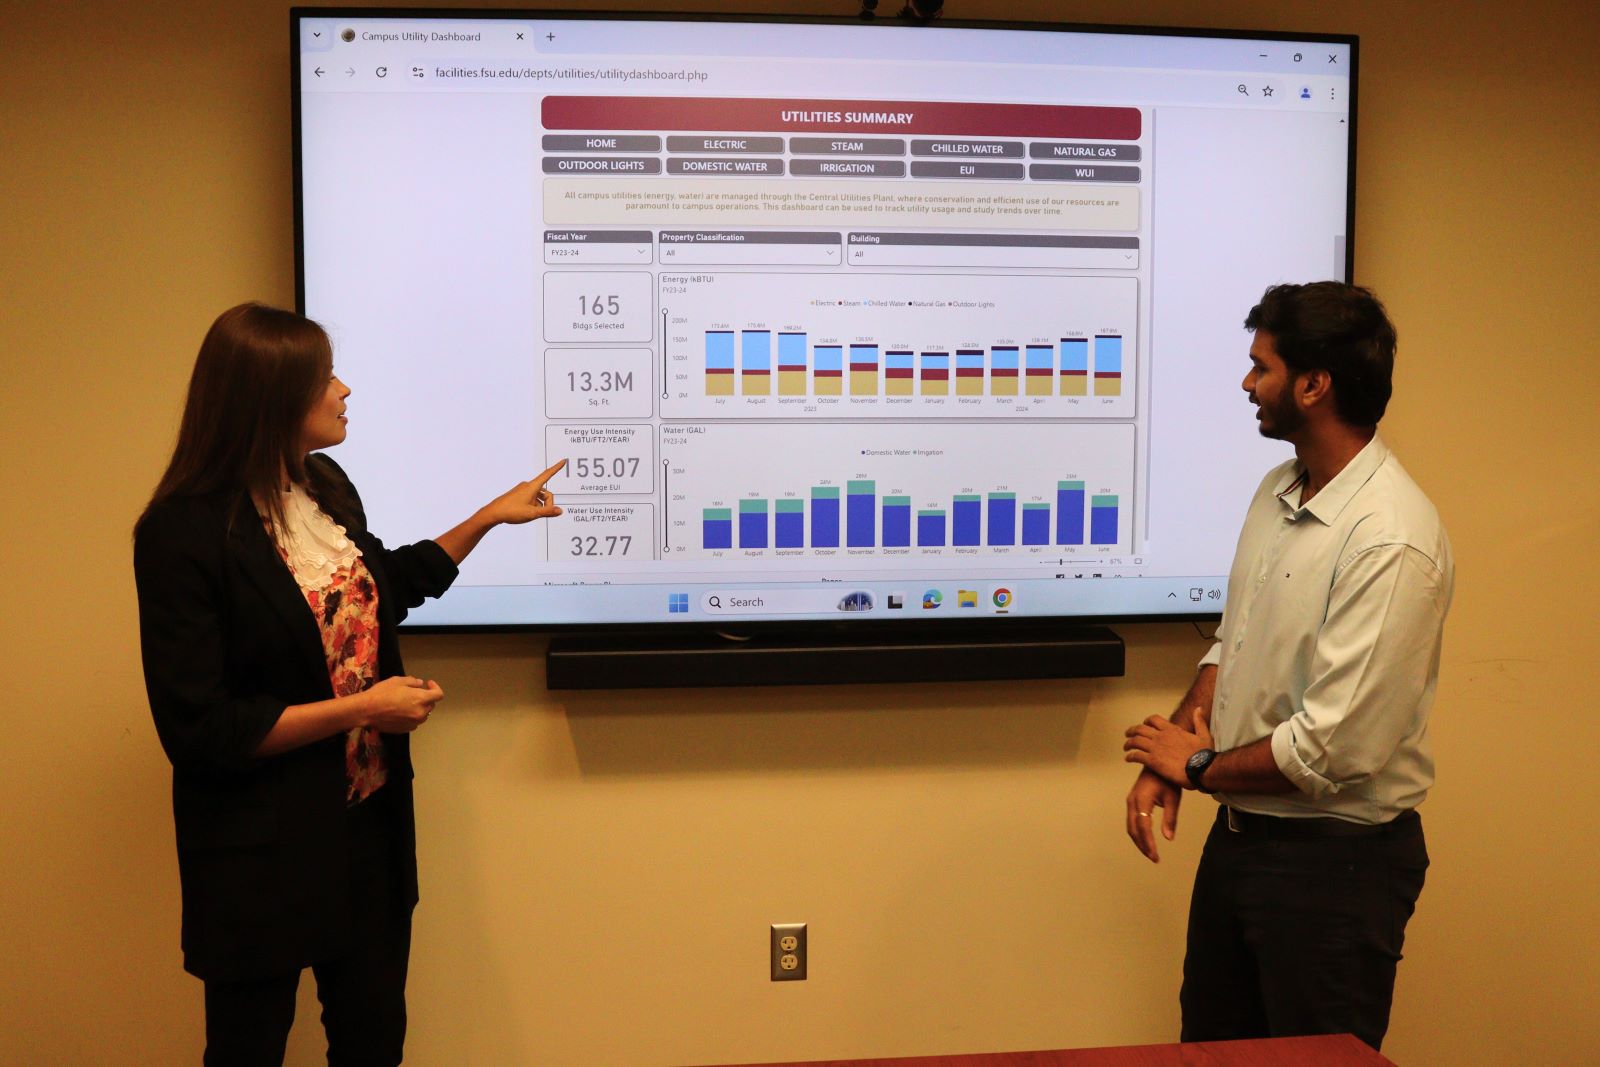
Marcela and Castaño and Kiran Muppana present the new Campus Utility Dashboard
“The dashboard provides valuable insight for Facilities, answering questions like, is this a potential capital replacement, or is there a leak that needs to be fixed/addressed?” BAS Specialist Marcela Castaño said. “It identifies areas of campus that require more attention from a maintenance or energy standpoint.”
The intuitive, user-friendly display that PowerBI provides enhances user experience and accessibility. Different color schemes and utility descriptions make the dashboard friendly to non-technical users. Users can filter data by year, building type, and building use, empowering them to focus on data applicable to their needs and make informed decisions. In the future, the BAS envisions adding select greenhouse gas data.
The dashboard has a broad impact, allowing Facilities and other campus partners to make data-driven decisions. Its accessibility allows leadership to view and explore data at any time. While the dashboard was designed with the future in mind, it also enables users to look at past years for anomalies and the impact of different Facilities projects and energy system improvements. From a maintenance perspective, the dashboard highlights deferred maintenance priorities, improving maintenance planning efforts. It provides a thorough method for Facilities Maintenance & Utilities to measure the results of campus energy management. The availability of the dashboard to the entire university community invites opportunities for inclusive planning, research, and collaboration across departments and academic units.
Visit the Campus Utility Dashboard at https://www.facilities.fsu.edu/depts/utilities/utilitydashboard.php


